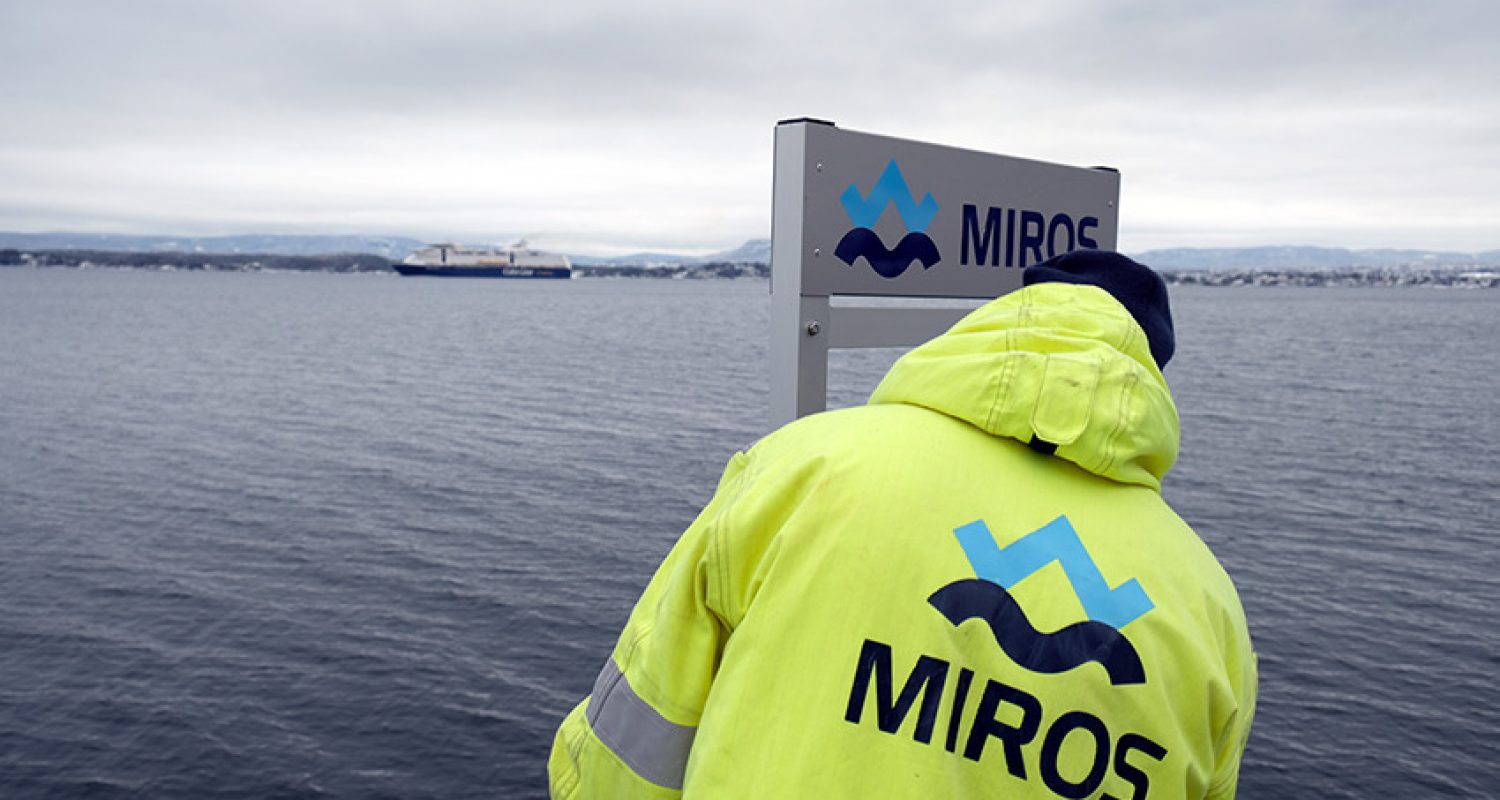
A greater understanding of the causes of coastal erosion and damage caused by daily ship-driven mini-tsunamis is obtained by Miros wave measurement sensors. The continuous data collection provides clear evidence which was used to educate captains to better understand the impact of speed and route on the vulnerable coastline.
In gravitas, wave measurement technology is being used to analyse ship-driven ‘mini-tsunamis’ which are becoming a regular occurrence in the shallow waterways of the Oslo fjord. This phenomenon is caused when a significant displacement of water takes place as some of the world’s largest cruise ferries pass at speed over pronounced variations in seabed depth near the Ildjernsflu lighthouse. This is a shallow region extending approximately 700m along the ship track and is around 14m at its shallowest depth. The depth before and after the shoal is approximately 46m.
Residents in Flaskebekk, a small village nestled within the fjord south of Oslo, frequently see the sea quickly retreat and drag the contents of the seashore with it. Then, a short time later, a strong, long wave over a metre high and up to 1km long is seen extending across the wide inlet. This runs up and down the shoreline each minute or so until the ship moves into more stable waters1&2. Research has found that the ship’s bow and stern may generate shorter waves, in addition to the long waves.
The investigation was sparked by an intense ‘supercell’ thunderstorm which hit a shallow area of the North Sea floor, generating 50km long depression waves up the Norwegian Trench. The forerunning ‘free wave’ arrived at the coast 24 minutes ahead of the wave attached to the storm. The large, violent waves crashed against piers and promenades causing significant damage and erosion. The incident baffled the country which had only ever experienced similar wave effects caused by landslides. Norwegian authorities were unable to connect any cause to the event.
Working alongside John Grue, an experienced professor of hydrodynamics at the University of Oslo, using Miros’ RangeFinder and WaveWeather technology to measure the height, length, and period of the ship-driven tsunamis free waves and compares it to the storm-induced event to understand more fully what causes them, and their potential impacts.
Surreal and frightening
Ships or vessels passing through a depth of water naturally create waves in their wake – this is widely acknowledged and understood. However, literature on free wave phenomena is lacking. This is largely because super cruise ferries were only introduced in Norway in the early 2000s. The 0.5–1km waves emerge when the ships move past the shallow, great depth changes of the fjord with the highest wave recorded being 1.4m. While this is far from the devastating tsunami assault around the Indian Ocean in 2004, locals living in the fjord are fearful for the environment and the impact on the economy.
The wavefront grows with the shallow water speed, upstream of the ships. Recent studies have found that while the speed of the ship itself will not prevent the ensuing wave, the faster it travels, the larger the wave will be.
The generation of free waves takes place during the period when the forced flow relaxes to the new depth. A sudden start-up from a wave’s ‘rest’ at constant depth is another source of free wave movement, both for ship-driven mini-tsunamis and in the case of the storm of June 20193. Although length and time scales are different in the various cases, there is a similar behaviour between meteotsunamis, ship-generated waves, and the waves generated by landslides and tectonic movement, or earthquakes.
The process to generate the free wave at the point where the depth changed in the fjord was calculated with fully dispersive mathematical model calculations.
Wave radar measurements were collected using Miros’ radar-based RangeFinder (SM-140) IoT sensor technology, installed dry on the shore at Flaskebekk Pier soon after the storm. The RangeFinder was combined with a weather station into a WaveWeather system to provide several additional environmental parameters such as wind speed, wind direction, precipitation, temperature, humidity, and air pressure. This means that with just power and an Internet connection, access to real-time data about the sea state is easily available and shareable on any device.
for more information and details ; https://miros-group.com/blog/mini-tsunami-mystery-solved/